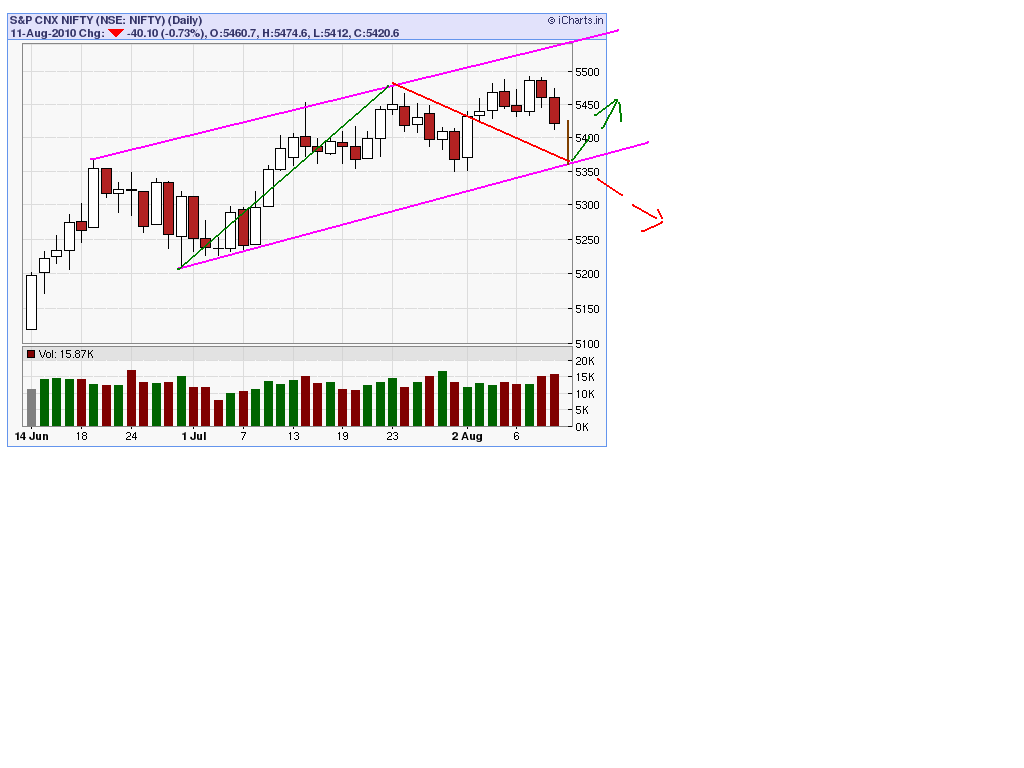
Wednesday, December 29, 2010

SENSEX AS ON 29.12.2010


comments on chart.

Thursday, December 23, 2010

ELLIOT WAVES BY CALDRO

for elliot wave followers 

a beautiful link with good charts showing wave counts.

http://caldaro.wordpress.com/2010/12/01/indias-sensex/


Friday, December 17, 2010

SENSEX AS ON 17.12.2010


3 charts are attached herewith. 

as shown in 60 min chart we are still moving in a downward channel and are at upper trend line.

as discussed on 3.12.2010, as shown in monthly chart support at green trend line ( which represents break out sideways 

channel) is taken.during last 2 weeks time mid cap n small cap stocks are corrected more in comparison of large cap.

if we see break out from downward channel , long positions can be taken in quality mid cap stocks only. since we are 

close  to year end, nav lifting exercise as well as dec qtr results may give upmoves in such stocks.

for wave count a link from blog of Ilangoji is attached herewith which shows different options.


FKONCO was recommended 


it closed at 109 yesterday.it has corrected from top near 190.  its illiuid scrip. patient investors can add it. in daily chart 

rsi is showing positive divergence. 

Friday, December 10, 2010

sensex weekly chart as on 9.12.10

look at weekly chart attached. after testing 20218 we are moving down again.sentiment is damaged.

long positions can be taken only after cross over of dnward channel which is looking very difficult 

in damaged sentiment. monthly chart upward channel is also broken.


Thursday, December 9, 2010

5 DAY SENSEX CHART AS ON 9.12.10

LOOK AT CHART.

Tuesday, December 7, 2010

MARKET AS ON 7.12.10

look at chart added as on 7.12.2010

***************************************************************
after testing 18955 market has moved up in last week and corrected 50% of fall from 21109 to 18955.

2 charts are attached herewith , one is monthly chart which i s indicative of broader picture.

second one is 60 minute chart showing short term movements and expected support and resistance areas.

comments are in charts.looking at sentiment by actions from regulatory body be selective 

in stocks preferably in large caps only and with strict stop losses .


Saturday, December 4, 2010

MARKET AS ON 3.12.10

after testing 18955 market has moved up in last week and corrected 50% of fall from 21109 to 18955.

2 charts are attached herewith , one is monthly chart which i s indicative of broader picture.

second one is 60 minute chart showing short term movements and expected support and resistance areas.

comments are in charts.looking at sentiment by actions from regulatory body be selective 

in stocks preferably in large caps only and with strict stop losses .

Tuesday, November 23, 2010

SENSEX AS ON 23.11.2010

look at charts attached. comments on chart.l

A Story of Appreciation - Must read


This is a powerful message in our modern society.

We seemed to have lost our bearing & our sense of direction.


One young academically excellent person went to apply for a managerial position in a big company.

He passed the first interview, the director did the last interview, made the last decision.

The director discovered from the CV that the youth's academic achievements were excellent all the way, from the secondary school until the postgraduate research, never had a year when he did not score.

The director asked, "Did you obtain any scholarships in school?" the youth answered "none".

The director asked, " Was it your father who paid for your school fees?" The youth answered, "My father passed away when I was one year old, it was my mother who paid for my school fees.

The director asked, " Where did your mother work?" The youth answered, "My mother worked as clothes cleaner. The director requested the youth to show his hands. The youth showed a pair of hands that were smooth and perfect.

The director asked, " Have you ever helped your mother wash the clothes before?" The youth answered, "Never, my mother always wanted me to study and read more books. Furthermore, my mother can wash clothes faster than me.

The director said, "I have a request. When you go back today, go and clean your mother's hands, and then see me tomorrow morning.*

The youth felt that his chance of landing the job was high. When he went back, he happily requested his mother to let him clean her hands. His mother felt strange, happy but with mixed feelings, she showed her hands to the kid.

The youth cleaned his mother's hands slowly. His tear fell as he did that. It was the first time he noticed that his mother's hands were so wrinkled, and there were so many bruises in her hands. Some bruises were so painful that his mother shivered when they were cleaned with water.

This was the first time the youth realized that it was this pair of hands that washed the clothes everyday to enable him to pay the school fee. The bruises in the mother's hands were the price that the mother had to pay for his graduation, academic excellence and his future.

After finishing the cleaning of his mother hands, the youth quietly washed all the remaining clothes for his mother.

That night, mother and son talked for a very long time.

Next morning, the youth went to the director's office.

The Director noticed the tears in the youth's eyes, asked: " Can you tell me what have you done and learned yesterday in your house?"

The youth answered, " I cleaned my mother's hand, and also finished cleaning all the remaining clothes'

The Director asked, " please tell me your feelings."

The youth said,

Number 1: I know now what is appreciation. Without my mother, I would not be successful me today.

Number 2: by working together and helping my mother, only I now realize how difficult and tough it is to get something done.

Number 3: I have come to appreciate the importance and value of family relationships.

The director said, " This is what I am looking for to be my manager.  I want to recruit a person who can appreciate the help of others, a person who knows the sufferings of others to get things done, and a person who would not put money as his only goal in life. You are hired."

Later on, this young person worked very hard, and received the respect of his subordinates. Every employee worked diligently and as a team. The company's performance improved tremendously.

A child, who has been protected and habitually given whatever he wanted, would develop "entitlement mentality" and would always put himself first. He would be ignorant of his parent's efforts. When he starts work, he assumes that every person must listen to him, and when he becomes a manager, he would never know the sufferings of his employees and would always blame others. For this kind of people, who may be good academically, may be successful for a while, but eventually would not feel sense of achievement. He will grumble and be full of hatred and fight for more. If we are this kind of protective parents, are we really showing love or are we destroying the kid instead?*

You can let your kid live in a big house, eat a good meal, learn piano, watch a big screen TV. But when you are cutting grass, scrubbing or cleaning the floor, running errands,  please let them experience it. After a meal, let them wash their plates and bowls together with their brothers and sisters. It is not because you do not have money to hire a maid, but it is because you want to love them in a right way. You want them to understand, no matter how rich their parents are, one day their hair will grow gray, same as the mother of that young person. The most important thing is your kid learns how to appreciate the effort and experience the difficulty and learns the ability to work with others to get things done.


DISCLAIMER:
The text of this email may contain information, which is proprietary and/or confidential or privileged in nature belonging to Kotak Mahindra Asset Management Co. Ltd. The recipient if not the addressee should not use this message if erroneously received and access to this email by anyone other than the addressee is unauthorized. The recipient if not the intended addressee should delete the message. The recipient acknowledges that Kotak Mahindra Asset Management Co Ltd. may be unable to exercise control or ensure or guarantee the integrity of the text of the email message and the text is not warranted as to completeness and accuracy and is subject to change without notice. The recipient further acknowledges that the views contained in the email message are those of the sender and may not necessarily reflect those of KMAMCL. Before opening and accessing the attachment please check and scan for virus.

If there is any reference to any scheme of Kotak Mutual Fund in this mail, such reference shall not be construed as advise for investment in the scheme or as literature for selling the scheme; receipient of this mail may read the offer document available on www.kotak.com to uderstand the details of the scheme and risks associated with it. If there is any reference to tax treatment with respect to any dividends, interest or capital gains or any such returns on any scheme of Kotak mutual fund, such reference shall not be construed as tax advise; receipeint of this mail shall consult his/her tax advisor for clarity and understanding tax implication.


Thursday, November 18, 2010

TRENDLINES GIVING SUPPORT & RESISTANCE

LOOK AT CHART . TREND LINES GIVING SUPPORT AND RESISTANCES ARE SHOWN.WE H AVE CLOSED BELOW 50 DMA FOR 

LAST 2 DYS.ON INTRADAY BASIS WE BROKE SUPPORT ZONE OF 19700/800 ZONE BUT ON CLOSING BASIS IT IS STILL 

INTACT.


Tuesday, November 16, 2010

MARKET

after making top of 20855 we saw correction up to 19769 and started moving up again and made new top at 21109.

19700/19800 has been a strong sup in sep and oct month.after making top at 21109 and making a new closing all time high 

market is correcting. watch 19700/19800 zone. break of same may bring more pain. next strong support zone may come at 

apprx 19200 on trend line connecting prev bottoms of 15960  and 17820.cross over of 20500 may give first indication of end of 

ongoing correction.

Monday, November 15, 2010

HPCL AS ON 15.11.2010

LOOK AT CHART ATTACHED.

COMMENTS ON CHART
***********************************
update as 1.12.10

hpcl has corrected alongwith market, has reached to a crucial sup zone, those holding can average here

Thursday, November 4, 2010

HAPPY DIWALI

Dear All,

May this Diwali Light up 

new dreams, fresh hopes, 

undiscovered avenues, 

different perspectives, 

everything bright 

& beautiful and 

fill all your 

days with 

pleasant surprises 

and moments.

Wish you all 

a very very happy &

 colorful Deepavali.


Saturday, October 30, 2010

SENSEX AS ON 29.10.2010

after last top at 20855 we have seen lower top at 20452. on Friday we bounced from strong sup area around 19800 from where no of bottoms are seen in chart.still we are in downward channel.coming days will be full of events which can have impact on markets and we may see volatility also.

* RBI  policy - change in interest rates
* FED  meeting- announcement of further actions
* Coal India listing - refunds credit
* Obama visit to India - IT/ Defense  industry related announcements

us dollar index and Indian rupee is also in sideways . quarterly earning season is almost over. liquidity from foreign flows ,             the major trigger for rally will  be decided in coming days . so we may see decisive move after clarity in next week.

decisive break of 19800 can generate sharp dnmoves bcz of tentative inverse head n shoulder pattern shown in chart.
decisive close above 20350 or decisive move above 20450 may indicate end of correction started from 20855  .

fibo levels for reference.

17820 to 20855

38.2 % 19696
50    % 19338
61.8 % 18979

20855 to 19769

38.2 % 20184
50   %  20312
61.8 % 20440 


Monday, October 25, 2010

Sunday, October 17, 2010

SENSEX AS ON 15.10.2010

as shown in chart we crossed recent top of 20706 and made new high of 20855 and have broken last low of 20107 which was made before top of 20855. sensex closed at 20125 on Friday . we have seen higher high and higher low pattern since may end from 15960. on decisive moves below 20107 that pattern will change and we will be in sell mode with stop loss of last top made at 20855.

actually we should watch market in global perspective more precisely, we should look at global currencies .us dollar index has gone below 77 where it may get support and bounce may be seen. as shown in daily chart of us dollar index +ve divergence is seen in rsi chart but price action is yet to give confirmation.with weakness in dollar funds are flow to relatively stronger economies. change of direction of the same may change direction of fund flow.

if profit booking seen in last week is for mega ipo of coal India only prices shd not correct more.watch price action. sharp moves in currencies may bring sharp corrections in equity,gold and crude markets.
***************************************************************
UPDATE AS ON 18.10.10

STOP LOSS OF 20107 TRIGGERED DECISIVELY. SELL WITH STOP LOSS OF 20855

****************************************************************

update as on 20.10.2010

we have made lower top of 20332 on 19.10.2010 and broken bottom of 19870 made on 18.10.2010

STOP LOSS REVISED FOR SELL POSITIONS FROM 20855 TO 20332.

*******************************************************************

UPDATE AS ON 23.10.2010

WE HAVE RETRACED UP TO APPRX LOWER TOP FORMED AROUND 20350 AND CORRECTED AGAIN.50% RETRACEMENT LVL OF FALL FROM 20855 TO 19823 IS ALSO AT 20339.US DOLLAR INDEX AND RUPEE HAS ALSO SHOWN SIMILAR PATTERNS.

DECISIVE MOVE ABOVE 20350 ZONE WILL BRING MORE STRENGTH.OTHERWISE WEAKNESS WILL CONTINUE.


Wednesday, October 13, 2010

STOP LOSS FOR LONG POSITIONS

NIFTY CROSSED PREV TOP OF 6222 AND MADE NEW TOP AND SENSEX ALSO TESTED PREV TOP (VERY CLOSE )

SO STOP LOSS LEVELS FOR LONG POSITIONS ARE REVISED AS GIVEN BELOW.

stop loss levels for short/medium and long term

short term  20107

medium term 17820

long term 15960


Thursday, October 7, 2010

US DOLLAR IND RUPEE MONTHLY CHART

LOOK AT CHART AND AND READ COMMENTS ON CHART.

Thursday, September 30, 2010

Business Standard: Sebi sticks to September 30 deadline for FII restructuring


Sebi sticks to September 30 deadline for FII restructuring
The Securities and Exchange Board of India (Sebi) has clarified that it would not extend the September 30 deadline for foreign institutional investors (FIIs) to restructure themselves as broad-based entities.
Read More
www.business-standard.com Email This Article


Wednesday, September 29, 2010

MARKET UPDATE AS ON 29.9.10

LOOK AT 5 CHARTS ATTACHED HEREWITH.

IN CHART SHOWING BEJAN DARUWALA'S PREDICTION OLD CHART IS PUT .

IT IS FOR REFERENCE OF HIS PAST PREDICTIONS.

**********************************************************

update as on 1.10.2010

new high made today

short term stop loss level is raised to 19864


Tuesday, September 21, 2010

CHANNELS

LOOK AT CHANNELS AND COMMENTS ON CHART.
**********************************************************

update as on 28.9.2010

stop loss levels for short/medium and long term

short term 19772

medium term 17820

long term 15960


Friday, September 17, 2010

MARKET VIEWS BY ILANGO

refer the link given below.excellent analysis is given which shows future trends options!

great work by Ilangoji.

enjoy!


Monday, September 13, 2010

Monday, September 6, 2010

Tuesday, August 31, 2010

MARKET UPDATE AS ON 31.8.10


update as on 7.9.10
on crossing 80% retracement level short covering and new long positions took market again today at top of channel.some profit booking may be seen here.
80% retracemnt zone (18350/5515) which was resistance previously may give support.

stop loss for long positions at 17820/5350

*************************************************
update as on 31.8.10

today we broke channel referred in chart dated 27.8.10, broken prev top made at 5367, broke 50dma / 50 ema zone all on intra day basis , tested critical support zone of 5350 also ( EXACT LOW 5349) and came back in the channel on closing basis.

since we r retracing from 5550 zone as discussed earlier and we have seen broad based selling from there only we shd be cautious for all long positions, we should not buy considering simply cheaper than higher price seen before.

as discussed we have seen smart money chasing defensive stocks like pharma, fmcg and power stocks.today good up move was seen in all major fmcg counters when mkt reversed from 5350.

retracement levels where we may get resistance in up move in coming days which may be used for generating cash.

38.2 % 18070/5427
50 % 18148/5450
61.8 % 18225/5473
80 % 18344/5510


********************************************************************************************************
20.8.10

my view is to alert all that we are poised at critical point in market. at a resistance of a channel running from long time and at critical fibo ratios time wise and price wise which can change direction in market.if this top of 5545 is crossed decisively then only we can see bullish moves immly otherwise chance of correcting are more.

us dollar index is on up move after correcting up to expected 80/82 zone and on crossing 83 again it will bring more n more weakness in us markets and up to what time we can be decoupled ?most of global markets have started weakening. liquidity is a driving force to sustain bullishness. when valuation are attractive in other markets or assets liquidity will shift and that can bring corrections.

better to move to defensive bets like fmcg/pharma/power time being for preservation of capital with some appreciation.let KING MARKET decide its direction.price has not shown any weakness. higher high and higher lows are seen.

one more technical matter, island reversal seen after first up move when lower top of 18895 was made (after top of 21206) is just filled. will we cross this zone?

****************************************************************************************************
18.8.10

NIFTY STILL IN CHANNEL. LOOKING AT RED RESISTANCE LINE RESISTANCE MAY COME BETN 5520 TO 5560 APPRX.


-

VIEWS OF MADHU KELA


DEAR INVESTOR

Hinting at near doubling of investments made in stocks, Anil Ambani group's renowned fund manager Madhusudan Kela has predicted that the benchmark Sensex will cross 30,000-point level in the next 3-5 years. Although cautious about the market outlook in the next three months, Kela told PTI that he was highly bullish in the longer term.

Kela will be taking over as the Chief Investment Strategist at Anil Ambani group's financial services arm Reliance Capital from September 21, following his elevation from Head of Equities at Reliance Mutual Fund currently.

"I am bullish about the stock market's performance in the medium to long term and expect the Sensex may even go beyond 30,000 level in the next 3-5 years. FII inflows are also expected to be robust in the long term," Kela said.

A surge in Sensex to over 30,000 level, from near 18,000 points currently, would mean close to 100 per cent rise in the next 3-5 years.

However, he is bearish about the short term and thinks the stock market may be impacted if FIIs start selling amid uncertainty in global markets.

"I expect the stock market may see a correction of around 10 per cent in the next three months if FII inflows, which are fuelling the stocks at present, become subdued. And there is not enough demand from domestic investors to keep the market afloat," Kela added.

Foreign Institutional Investors (FIIs) have poured in as much as Rs 11, 447.60 crore so far in August, according to data available on the Securities and Exchange Board of India (Sebi) website.

With improving global economic conditions, the FII investments have been robust this year with their total inflows close to Rs 60,000 crore so far in 2010.

The BSE benchmark index Sensex had settled at below the 18,000 mark at 17,998.41 down 227 points on Friday last week.

From January to August, the Sensex has been moving mostly in the range of 16,000-17,000 levels, though it had touched its highest level of 18,475 points for the first time since February 2008 on August 19.

Asked if Indian equities at present were overvalued as compared to their peers in BRIC (Brazil, Russia and China and India), Kela said, "foreign investors are still bullish on Indian stocks as they are still under owned by them as compared to Chinese equities."

With his new responsibilities, Kela would play a crucial role in expanding Reliance Capital's businesses, mentoring portfolio managers and providing strategic inputs and guidance on investments across the RCAP group of firms


Monday, August 30, 2010

Saturday, August 28, 2010

NIFTY AS ON 27.8.10

look at chart attached.

stocks looking positive for next week : ongc & ntpc
*******************************************************
update on 30.8.10

ongc showing strength, power grid has also started moving up can be watched for

short term upmove.

Friday, August 20, 2010

NIFTY IN CHANNEL AS ON 19.8.10

NIFTY STILL IN CHANNEL. RESISTANCE MAY COME BETN 5520 TO 5560 APPRX.

look at bigger channel with interesting fibo levels.
********************************************************************************************************
my view is to alert all that we are poised at critical point in market. at a resistance of a channel running from long time and at critical fibo ratios time wise and price wise which can change direction in market.if this top of 5545 is crossed decisively then only we can see bullish moves immly otherwise chance of correcting are more.

us dollar index is on up move after correcting up to expected 80/82 zone and on crossing 83 again it will bring more n more weakness in us markets and up to what time we can be decoupled ?most of global markets have started weakening. liquidity is a driving force to sustain bullishness. when valuation are attractive in other markets or assets liquidity will shift and that can bring corrections.

better to move to defensive bets like fmcg/pharma/power time being for preservation of capital with some appreciation.let KING MARKET decide its direction.price has not shown any weakness. higher high and higher lows are seen.

one more technical matter,gap seen when island reversal was seen after first up move when lower top of 18895 was made (after top of 21206) is just filled. will we cross this zone?


Thursday, August 19, 2010

NIFTY IN CHANNEL AS ON 19.8.10


look at bigger channel with interesting fibo levels.

Wednesday, August 18, 2010

NIFTY IN CHANNEL AS ON 18.8.10

NIFTY STILL IN CHANNEL. LOOKING AT RED RESISTANCE LINE RESISTANCE MAY COME BETN 5520 TO 5560 APPRX.

GMR INFRA AS ON 17.8.10


LOOK AT CHART OF  GMR INFRA 

Saturday, August 14, 2010

UPDATE ON SBI AS ON 13.8.10

LOOK AT CHART ATTACHED, COMMENTS ON CHART

Friday, August 13, 2010

are we moving in a channel?


look at chart. are we moving in a channel?

so far we are in channel!


Thursday, August 12, 2010

are we moving in a channel?

look at chart. are we moving in a channel?

Wednesday, August 11, 2010

SENSEX AS ON 10.08.2010

CHART SHOWING SUPPORTS

NEED OF INSURANCE

If you have dependants and financial responsibilities towards them, then you certainly need insurance. Having a family means dependants; this in turn means financial commitments. Financial commitments come in the form of loans, children's education, Medical expenses etc.

When you insure your life, in effect what you are doing is insuring your earning capacity. This guarantees that your dependants will be able to continue living as the same status as before without hardships.
Most insurance plans available today come with a savings element built into it which would enable you to have a comfortable retirement.

These policies help you plan not only for protection against death but also for a financially independent future.

 The amount of premiums payable depends upon the type of policy, term of policy sum and your age. You could pay these premiums monthly/half-yearly/annually.

Tuesday, August 10, 2010

US DOLLAR INDEX / UPDATE AS ON 10.8.10

update as on 10.8.10

us dollar index has tested 80 zone approximately and bounced from there with +ve divergence in daily chart as shown in attached chart.equity markets move in inverse direction normally.read more comments on charts.


*********************************************************************************************************
8.7.10


LOOK AT CHART OF US DOLLAR INDEX ATTACHED HEREWITH.ITS MOVEMENT MAY GUIDE 

US FOR FURTHER MOVES IN EQUITY MARKET.BELOW 83.3LEVEL NEXT SUPPORT ZONE IS 

BETN 80 AND 82 ZONE . 200 DMA IS NEAR 82 AND 200EMA IS SHOWN IN CHART.NORMALLY 

WEAKNESS IN US DOLLAR INDEX HAD HELPED FOR UP MOVES IN EQUITY MARKETS AND 

GOLD.


MARKET

STOP LOSS LEVELS

SHORT TERM 18118/5431

MEDIUM TERM 17395/5210

LONG TERM  15960/4796

SO FAR WE ARE OBSERVING HIGHER LOWS AND HIGHER HIGHS.BE CAUTIOUS IN LONG POSITIONS.

ON WEAKNESS IN EURO US DOLLAR INDEX IS SHOWING STRNGTH AFTER TESTING APPRX 80  ZONE.DAILY CHARTS ARE 

SHOWING +VE DIVERGENCE AND PRICE IS ALSO SHOWING +VE ACTION. STRENGTH IN US DOLLAR INDEX MAY BRING 

WEAKNESS IN EQUITY MARKETS.


Monday, August 9, 2010

views of Shrikant Chouhan, Technical analyst

The week past and expected
The market is under compression mode as the market is failing to trade above 5450/5470 levels even though the world
markets are doing well. As per daily chart the market is diverging negatively which is an indication of pause of the current
trend or likely shift in coming few days. Even if we look at the daily trend of the market then one can clearly notice that
it is under rising wedge formation that suggests us phase of distribution. Currently it has final support at 5350/17840 but
it seems difficult to break in the near term.
As per our past experience and findings it seems that it will spend time between 5350 and 5520 (maximum on the higher
side) and dismissal of the range will trigger "massive break out or break down on either side. We feel that the market will
break the lower band but while looking at world markets and status of the domestic currency it may even break upward
range. On the dismissal of the lower range we may expect minimum 5200/17370 lower side.
Sector specific: Banks, IT, Auto and Consumer durables may do well however, buying is advisable only at major supports
or on declines. Reality and Cement stocks one can trade on recoveries from lower levels and not on dips. Capital goods,
Infra, Pharmaceuticals and Metal stocks may find resistance at higher levels as profit taking will minimize the upside for
the same. Even midcap and small cap stocks may come under pressure of profit taking as the current move seems to be
over extended; be cautious or choose while investing at current and at higher levels.
Nifty Strategy: For the day, selling is advisable below 5430 with a tight stop loss above 5460 and for the target 5380 and
5365. In the second half, if the market sustains above 5460 then buying is advisable with a stop loss below 5430 for the
target 5490 and 5520.


updates from VIVEK PATIL

9/08/10

updates from vivek patil.

*************************************************************************************************************************


Even if we do see further rallies, the question right now is whether the same would keep facing profit-booking, even if they do hit higher
levels. Previous two new highs of Jul'10 did get sold into, firstly at 18167, and then at 18238. In fact, the bigger picture since last Oct
shows all news highs of this rally attracted selling, each time Sensex shaving off 2100 to 2400 points.
Structurally, the "i" leg appears to be developing as a Contracting Triangle. The "c" leg was 61.8% of "a", and "d" was 61.8% of
"b", forming into contraction. The "e" leg will achieve 61.8% ratio to "c" leg at about 17325.
Though not resisted at 80% retracement level, topping formations can even show Double Tops or measured higher highs.
Topping action usually turns out to be a tricky affair, and the same will be expected as long as the Sensex keeps its head
below the maximum potential of 18357.
That potential was also explained as the upper end of the year-long channel shown on the Daily chart.
To keep any bullish option open for the next week, Sensex should not only move above last week's high of 18295, but
also above 18357 level.
 

Friday, August 6, 2010

SBI LOOKING WEAK

LOOK AT CHART .

TIME TO SHORT SBI SHARES. ONE CAN BUY PUTS ALSO TO SHORT .
*************************************************************************************
IF WE TRY TO WORK OUT UPMOVE FROM 894 TO 2663 IN 5 SUB WAVES

* 894 TO 1935
* 1935 TO 1512
* 1512 TO 2500
* 2500 TO 1863
* 1863 TO 2663


Monday, July 19, 2010

Fwd: BUY NTPC ABOVE 203


BUY NTPC ABOVE 203.

STOP LOSS BELOW 196 ON CLOSING BASIS.
************************************************
update as on 19.7.10

ntpc 204


HAVE WE TOPPED AT 18167 OR WE ARE VERY CLOSE TO TOP ?

WE ARE MOVING IN A SIDEWAYS CHANNEL SINCE TOP MADE AROUND 17500 LAST YEAR.LOWS ARE NEAR 15000/15500 

AND HIGHS ARE IN 18000/18167(top so far) RANGE.

GLOBAL MARKETS ARE IN RELATIVELY BAD SHAPE. WE MAY FOLLOW THEM.RESULT SEASON IS GOING TO BE OVER 

SOON.WE MIGHT HAVE TOPPED AT 18167 OR WE ARE VERY CLOSE TO IT.ONLY A DECISIVE CLOSE ABOVE THIS 

CHANNEL   CAN BRING BULLISH OPTIONS TECHNICALLY.

BREAK OUT OR BREAK DOWN FROM THIS CHANNEL MAY BRING TARGETS OF 23K OR 13K IN PLAY IN COMING 

QUARTERS.

I MAY GO TOTALLY WRONG IN MY VIEW ALSO.DO YOUR OWN STUDIES.

VIEWS ARE WELCOME.


PANKAJ SHAH

19.7.2010