update as on 7.9.10
on crossing 80% retracement level short covering and new long positions took market again today at top of channel.some profit booking may be seen here.
80% retracemnt zone (18350/5515) which was resistance previously may give support.
stop loss for long positions at 17820/5350
*************************************************
update as on 31.8.10
today we broke channel referred in chart dated 27.8.10, broken prev top made at 5367, broke 50dma / 50 ema zone all on intra day basis , tested critical support zone of 5350 also ( EXACT LOW 5349) and came back in the channel on closing basis.
since we r retracing from 5550 zone as discussed earlier and we have seen broad based selling from there only we shd be cautious for all long positions, we should not buy considering simply cheaper than higher price seen before.
as discussed we have seen smart money chasing defensive stocks like pharma, fmcg and power stocks.today good up move was seen in all major fmcg counters when mkt reversed from 5350.
retracement levels where we may get resistance in up move in coming days which may be used for generating cash.
38.2 % 18070/5427
50 % 18148/5450
61.8 % 18225/5473
80 % 18344/5510
********************************************************************************************************
20.8.10
my view is to alert all that we are poised at critical point in market. at a resistance of a channel running from long time and at critical fibo ratios time wise and price wise which can change direction in market.if this top of 5545 is crossed decisively then only we can see bullish moves immly otherwise chance of correcting are more.
us dollar index is on up move after correcting up to expected 80/82 zone and on crossing 83 again it will bring more n more weakness in us markets and up to what time we can be decoupled ?most of global markets have started weakening. liquidity is a driving force to sustain bullishness. when valuation are attractive in other markets or assets liquidity will shift and that can bring corrections.
better to move to defensive bets like fmcg/pharma/power time being for preservation of capital with some appreciation.let KING MARKET decide its direction.price has not shown any weakness. higher high and higher lows are seen.
one more technical matter, island reversal seen after first up move when lower top of 18895 was made (after top of 21206) is just filled. will we cross this zone?
****************************************************************************************************
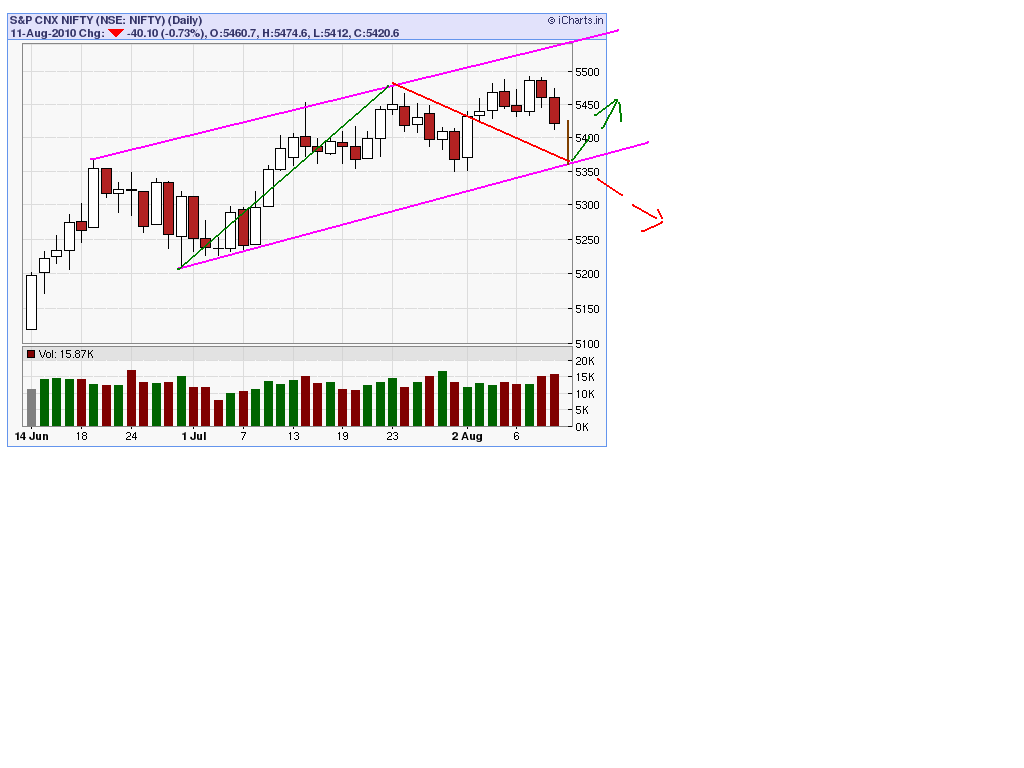
18.8.10
NIFTY STILL IN CHANNEL. LOOKING AT RED RESISTANCE LINE RESISTANCE MAY COME BETN 5520 TO 5560 APPRX.
-