Wednesday, August 18, 2010

GMR INFRA AS ON 17.8.10


LOOK AT CHART OF  GMR INFRA 

Saturday, August 14, 2010

UPDATE ON SBI AS ON 13.8.10

LOOK AT CHART ATTACHED, COMMENTS ON CHART

Friday, August 13, 2010

are we moving in a channel?


look at chart. are we moving in a channel?

so far we are in channel!


Thursday, August 12, 2010

are we moving in a channel?

look at chart. are we moving in a channel?

Wednesday, August 11, 2010

SENSEX AS ON 10.08.2010

CHART SHOWING SUPPORTS

NEED OF INSURANCE

If you have dependants and financial responsibilities towards them, then you certainly need insurance. Having a family means dependants; this in turn means financial commitments. Financial commitments come in the form of loans, children's education, Medical expenses etc.

When you insure your life, in effect what you are doing is insuring your earning capacity. This guarantees that your dependants will be able to continue living as the same status as before without hardships.
Most insurance plans available today come with a savings element built into it which would enable you to have a comfortable retirement.

These policies help you plan not only for protection against death but also for a financially independent future.

 The amount of premiums payable depends upon the type of policy, term of policy sum and your age. You could pay these premiums monthly/half-yearly/annually.

Tuesday, August 10, 2010

US DOLLAR INDEX / UPDATE AS ON 10.8.10

update as on 10.8.10

us dollar index has tested 80 zone approximately and bounced from there with +ve divergence in daily chart as shown in attached chart.equity markets move in inverse direction normally.read more comments on charts.


*********************************************************************************************************
8.7.10


LOOK AT CHART OF US DOLLAR INDEX ATTACHED HEREWITH.ITS MOVEMENT MAY GUIDE 

US FOR FURTHER MOVES IN EQUITY MARKET.BELOW 83.3LEVEL NEXT SUPPORT ZONE IS 

BETN 80 AND 82 ZONE . 200 DMA IS NEAR 82 AND 200EMA IS SHOWN IN CHART.NORMALLY 

WEAKNESS IN US DOLLAR INDEX HAD HELPED FOR UP MOVES IN EQUITY MARKETS AND 

GOLD.


MARKET

STOP LOSS LEVELS

SHORT TERM 18118/5431

MEDIUM TERM 17395/5210

LONG TERM  15960/4796

SO FAR WE ARE OBSERVING HIGHER LOWS AND HIGHER HIGHS.BE CAUTIOUS IN LONG POSITIONS.

ON WEAKNESS IN EURO US DOLLAR INDEX IS SHOWING STRNGTH AFTER TESTING APPRX 80  ZONE.DAILY CHARTS ARE 

SHOWING +VE DIVERGENCE AND PRICE IS ALSO SHOWING +VE ACTION. STRENGTH IN US DOLLAR INDEX MAY BRING 

WEAKNESS IN EQUITY MARKETS.


Monday, August 9, 2010

views of Shrikant Chouhan, Technical analyst

The week past and expected
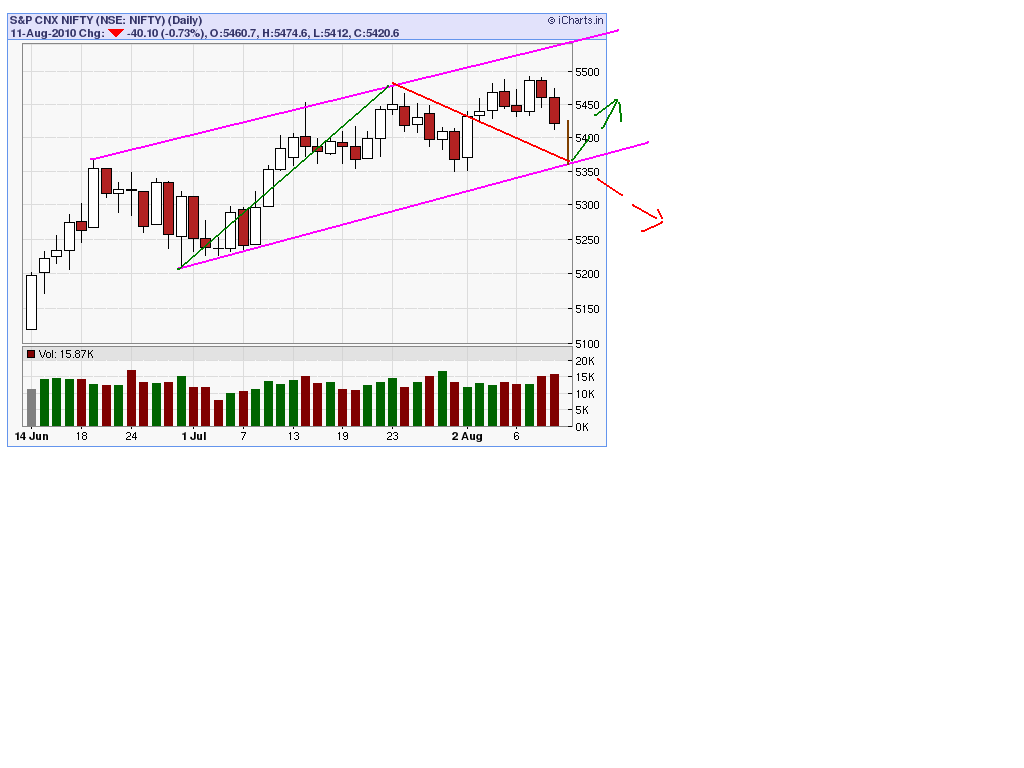
The market is under compression mode as the market is failing to trade above 5450/5470 levels even though the world
markets are doing well. As per daily chart the market is diverging negatively which is an indication of pause of the current
trend or likely shift in coming few days. Even if we look at the daily trend of the market then one can clearly notice that
it is under rising wedge formation that suggests us phase of distribution. Currently it has final support at 5350/17840 but
it seems difficult to break in the near term.
As per our past experience and findings it seems that it will spend time between 5350 and 5520 (maximum on the higher
side) and dismissal of the range will trigger "massive break out or break down on either side. We feel that the market will
break the lower band but while looking at world markets and status of the domestic currency it may even break upward
range. On the dismissal of the lower range we may expect minimum 5200/17370 lower side.
Sector specific: Banks, IT, Auto and Consumer durables may do well however, buying is advisable only at major supports
or on declines. Reality and Cement stocks one can trade on recoveries from lower levels and not on dips. Capital goods,
Infra, Pharmaceuticals and Metal stocks may find resistance at higher levels as profit taking will minimize the upside for
the same. Even midcap and small cap stocks may come under pressure of profit taking as the current move seems to be
over extended; be cautious or choose while investing at current and at higher levels.
Nifty Strategy: For the day, selling is advisable below 5430 with a tight stop loss above 5460 and for the target 5380 and
5365. In the second half, if the market sustains above 5460 then buying is advisable with a stop loss below 5430 for the
target 5490 and 5520.


updates from VIVEK PATIL

9/08/10

updates from vivek patil.

*************************************************************************************************************************


Even if we do see further rallies, the question right now is whether the same would keep facing profit-booking, even if they do hit higher
levels. Previous two new highs of Jul'10 did get sold into, firstly at 18167, and then at 18238. In fact, the bigger picture since last Oct
shows all news highs of this rally attracted selling, each time Sensex shaving off 2100 to 2400 points.
Structurally, the "i" leg appears to be developing as a Contracting Triangle. The "c" leg was 61.8% of "a", and "d" was 61.8% of
"b", forming into contraction. The "e" leg will achieve 61.8% ratio to "c" leg at about 17325.
Though not resisted at 80% retracement level, topping formations can even show Double Tops or measured higher highs.
Topping action usually turns out to be a tricky affair, and the same will be expected as long as the Sensex keeps its head
below the maximum potential of 18357.
That potential was also explained as the upper end of the year-long channel shown on the Daily chart.
To keep any bullish option open for the next week, Sensex should not only move above last week's high of 18295, but
also above 18357 level.