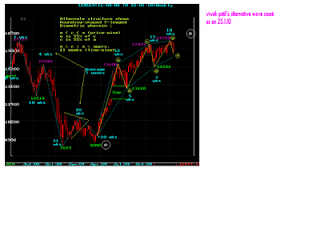
VIVEK PATIL ALTERNATIVE VIEW AS ON 25.1.2010
Structure of the Sensex can remain positive if it holds well about 15331 by Feb'2010. Wavecount- wise, downside holding above 15331 can be marked either as "x" (as shown on the opening chart), OR as "f" as per the alternative structure presented below.
Weak trading below 15331 would, however, justify Sensex having hit maturity levels or a major top around 17735.Wave-wise, it would mean "B" leg rally from Mar'09 lows got over at 17493 during Oct'08,from where "C" has already been forming for downward targets of 13500 (Gap-up of
May08) / 11850 (60% correction level) / 10600 (80% correction level).
On the alternate structure shown on the chart above, one may notice an interesting time analysis.Like 10-week long falling segments during the post-Jan'10 bear phase, I had pointed out about 13-week long rallying segments during the Post-Mar'09 rise.
After each rallying segment, chart shows a falling segment of 3-5 weeks. After the 10-week rally to 17780, we are now into the falling segment, This may continue for 3-5 weeks, taking us into Feb'10, which has been considered crucial time period for continuing bullish expectations.
Price-wise, each subsequent rallying segment has been 55% of the previous rallying segment. It indicates loss of bull-power, despite hitting newer highs of the larger rally.
Structurally, the larger rally since Mar'09 continues to be marked as a "B" wave corrective leg to the 14-month fall ("A" leg) even within this alternative. In Triangles, "B" leg can consume lessertime than "A".
The "B" leg of a Triangle can form as a 3-legged pattern (Zigzag or Flat) or as a 7-legged pattern called Diametric. We cannot mark "B" as a 5-legged pattern, i.e. Triangle. The up-move since Mar'09 is, therefore, possibly developing as a 7-legged Diametric
The current drop from Jan'10 high of 17780 becomes its "f" leg, after which the last leg, i.e. "g" leg,
would develop upwards, preferably reaching levels higher than 17780 (even 22000), if it is not a
Failure leg ("g" leg can be a Failure leg).


