

--
Concentrate all your thoughts upon the work at hand. The sun`s rays do not burn until brought to a focus.
- Alexander Graham Bell

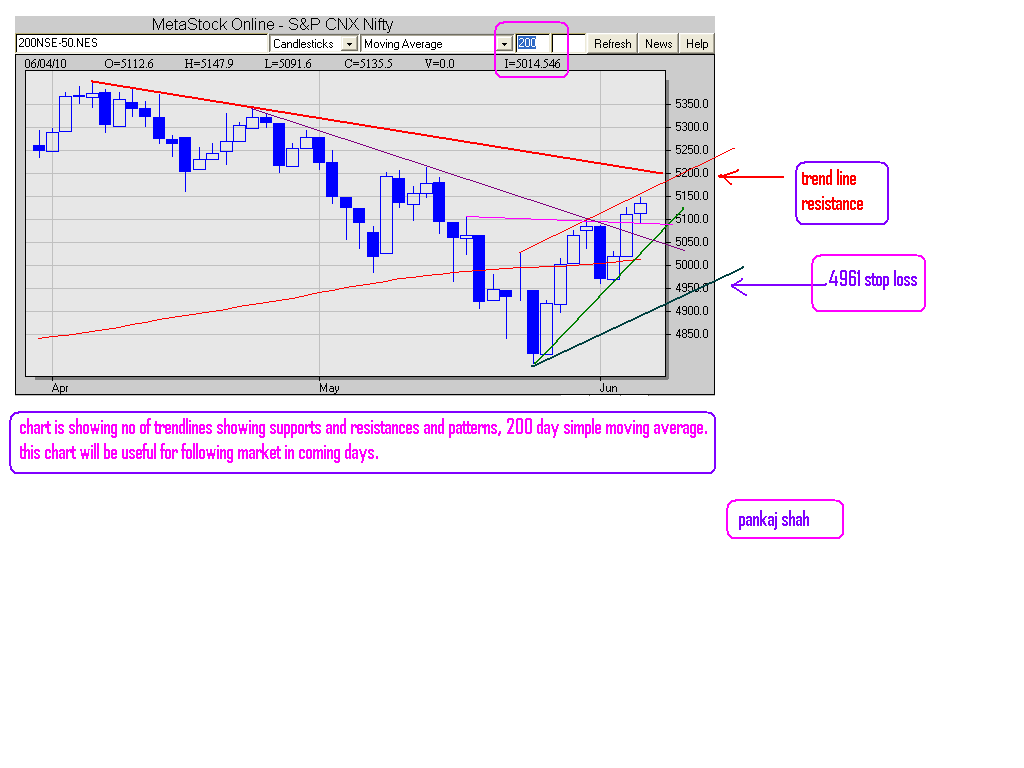
LOOK AT CHART ATTACHED
********************************************
update as on 9.6.10 3.18 pm
we have broken green trend line giving support.
long positions not advisable.


