
Friday, April 9, 2010
BUY HIND UNI LEVER AT 221
HIND UNILEVER IS SHOWING +VE DIVERGENCE IN DAILY AS WELL AS WEEKLY CHARTS.
IT IS AT 61.8 % RETRACEMNET LEVEL OF LAST RISE FROM 166 TO 306.
CAN BE BOUGHT AT CMP 221.
ITS A LONG TERM INVESTMENT CALL.
Thursday, April 8, 2010
INVERSE HEAD N SHOULDER BREAK OUT IN GOLD

look at chart attached. inverse head and shoulder pattern can be seen. we may see 1200+ usd lvls in coming days.
violation of neck line will make pattern invalid.
************************************************************
UPDATE AS ON 12.05.10
GOLD TESTED TODAY 1244 DOLLAR.
TARGET ACHIEVED. PART PROFIT BOOKING IS ADVISED
Tuesday, April 6, 2010
RPOWER INVERSE HEAD N SHOULDER

CHART ATTACHED.
**************************************************************************************************
TARGET ACHIEVED.
TODAY'S HIGH 159.9
CLOSE 158.8
Monday, April 5, 2010
MARKET AND STOCK IDEAS
sensex crossed 17793. so now our stop loss gets revised from 17337 to next higher bottom at 17488.
stock ideas:
tata investments cmp 514 can be bought for short term with stop loss below 488 on closing basis.
til cmp 344 can be bought with stop loss below 330 on closing basis
sona koya cmp 19 , can be bought above 19.5 with stop loss below 18.3 on closing basis
reliance capital cmp 781 can be bought with stop loss below 752 on closing basis
FOLLOW STOP LOSSES STRICTLY.

Saturday, April 3, 2010

MARKET

observations:-
sensex is still making higher high higher low pattern.
trend line from bottom of 15652 still intact.
pace has slowed down.divergence in favour of mid can and small cap stocks can be seen
bcz A/D ratio has started showing positive nos on dn days also.
result calender effects in coming few weeks will be seen.
reliance has started up move again after closing around 1071.
in weekly chart rsi has crossed trend line after a very long time although with -ve divergence.
in weekly chart macd is just testing trigger line. crossover will show positive moves.
in daily chart rsi is still showing -ve divergence.
we are up by nearly 13% from last major bottom of 15652.
stop loss for long positions is at 17337. since we are far away from bottom,
stop loss should be followed strictly. on crossing 17793 stop loss will be revised to next
higher bottom at 17488.
Monday, March 29, 2010
IOC/HPCL AND BPCL SHOWING +VE DIVERGENCE
IOC/BPCL/HPCL SHOWING +VE DIVERGENCE.
GOOD FOR SHORT TERM TRADING
Sunday, March 28, 2010
MARKET?
Market is very close to jan 2010 tops at 17790/5310. on weekly closing basis higher closes are seen.
in weekly charts we have just tested trend line in rsi chart which has been giving resistance since june 2009.
in daily charts rsi has started showing -ve divergence. price action required for weakness confirmation.
on crossing 17790 different resistance levles will come in play between 18k to 18.5k
80% retracement of total fall from 21206 to 7697 comes at 18504.
next week we will be having financial yr ending , we may see nav based actions.
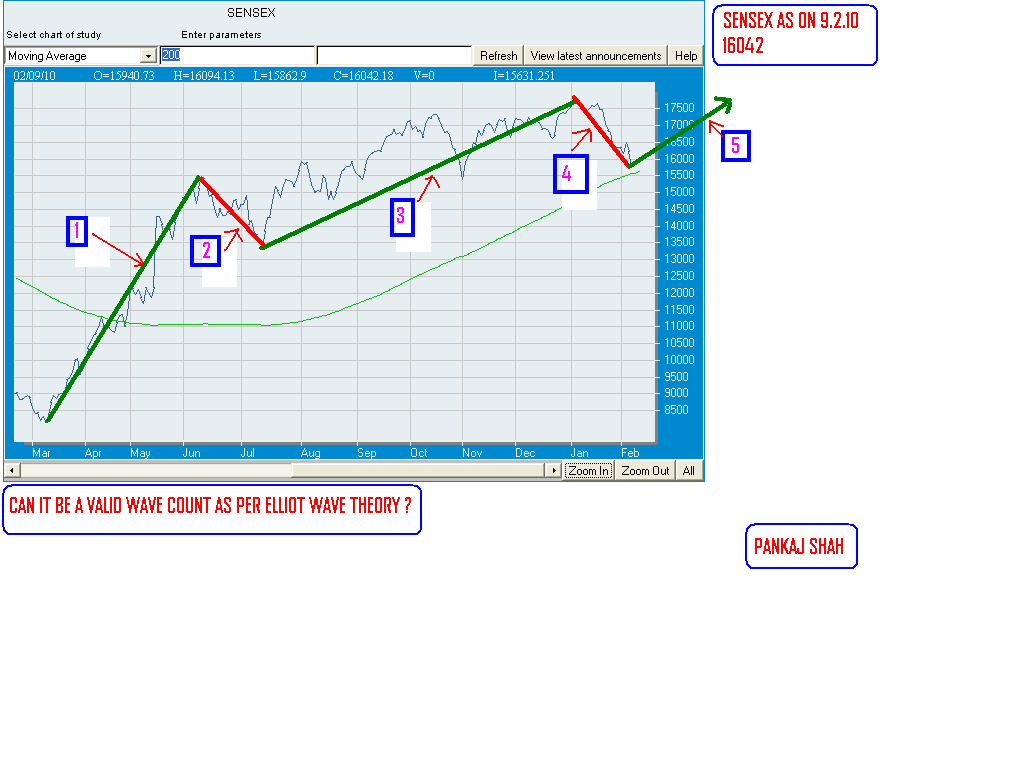
I had sent one chart as a query to elliot experts on 9/2/010.
market has moved in direction shown as per chart.
I REVISE STOP LOSS TO 17337 FOR ALL LONG POSITIONS.
Subscribe to:
Posts (Atom)