Wednesday, January 27, 2010

ALL IS WELL ?

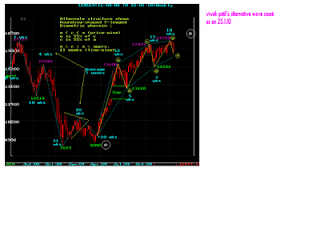
i have attached 2 charts. one is alternative wave count by vivek patil which was shown with his weekly report on 25.1.10 and 2nd chart is with today's market.

if ALL IS WELL  in this market than we shd start upmove very soon.today rsi level is same as we were at 15331 and we have closed at 16290. that shows that still there is a hope for an up move.i have tried another wave count for that and this is purely an effort to predict market move in advance which can fail totally also.take yr decision with proper care.

**********************************************************

TODAY WE HAVE TESTED SUPPORT ZONE AS PER " ALL IS WELL " AND BOUNCED FROM THERE.
F N O EXPIORY IS OVER.
RBI POLICY IS OVER.
NEXT TRIGGERE?
BUDGET AND DISINVESTMENT IPOS. GOVT WILL NEED +VE ENVIORNMENT.

KEEP STRICT STOP LOSS OF TODAY'S LOW AT 15982.
*********************************************************
ALL IS WELL STOP LOSS 15982 BROKEN.
WAIT FOR HIGHER LOW AND HIGHER HIGH FORMATION FOR ANY LONG POSITION.

VIVEK PATIL'S ALTERNATIVE VIEW

VIVEK PATIL ALTERNATIVE VIEW AS ON 25.1.2010


Structure of the Sensex can remain positive if it holds well about 15331 by Feb'2010. Wavecount- wise, downside holding above 15331 can be marked either as "x" (as shown on the opening chart), OR as "f" as per the alternative structure presented below.


Weak trading below 15331 would, however, justify Sensex having hit maturity levels or a major top around 17735.Wave-wise, it would mean "B" leg rally from Mar'09 lows got over at 17493 during Oct'08,from where "C" has already been forming for downward targets of 13500 (Gap-up of

May08) / 11850 (60% correction level) / 10600 (80% correction level).


On the alternate structure shown on the chart above, one may notice an interesting time analysis.Like 10-week long falling segments during the post-Jan'10 bear phase, I had pointed out about 13-week long rallying segments during the Post-Mar'09 rise.


After each rallying segment, chart shows a falling segment of 3-5 weeks. After the 10-week rally to 17780, we are now into the falling segment, This may continue for 3-5 weeks, taking us into Feb'10, which has been considered crucial time period for continuing bullish expectations.


Price-wise, each subsequent rallying segment has been 55% of the previous rallying segment. It indicates loss of bull-power, despite hitting newer highs of the larger rally.


Structurally, the larger rally since Mar'09 continues to be marked as a "B" wave corrective leg to the 14-month fall ("A" leg) even within this alternative. In Triangles, "B" leg can consume lessertime than "A".


The "B" leg of a Triangle can form as a 3-legged pattern (Zigzag or Flat) or as a 7-legged pattern called Diametric. We cannot mark "B" as a 5-legged pattern, i.e. Triangle. The up-move since Mar'09 is, therefore, possibly developing as a 7-legged Diametric


The current drop from Jan'10 high of 17780 becomes its "f" leg, after which the last leg, i.e. "g" leg,

would develop upwards, preferably reaching levels higher than 17780 (even 22000), if it is not a

Failure leg ("g" leg can be a Failure leg).


Saturday, January 23, 2010

MARKET?

Friends

in last few mails i have been mentioning stop loss of 16578 for all long positions. yesterday we made low of 16608 and closed at 16859.level of 16608 is very close to 75% of rise from 16210 to 17790. its also imp weekly closing support area.
as per our 1-2-3 pattern if we break 16578 our stop loss will be violated and it will be case of sell on rise till we see higher bottom and higher top formation.

dow charts are also attached herewith.previously we had seen good up move as per 30.10.09 chart from 50 ema support area.now it has reversed from long term trend line  resistance. so chances are there dow have made an intermediate top.

what next?
if we break 16578 we have to assume that sensex has also made in intermediate top at 17790 and we can see further corrections. next strong support areas are 16k and 15600.

more over 100 dma is also shown in chart. during fall of 2008 i have been referring in my mails that we are facing strong resistance at 100 dma. and we shd be positive on our markets when we close above 100 dma. similarly during rise of 2009 100 dma has given strong support to our markets. we have closed just above it. violation of the same will be bearish for coming days.

dec qtr earning season is near the end. further moves will be as per stocks performances and expected performance expectations.

Thursday, January 21, 2010

SENSEX AS ON 21.1.10

when we were near 17700, it was expected that we may correct as shown in this mail.


now if we follow wave count mostly we have completed sub wave B.c.4 today at 17025  or even if we correct from here we shd not close below 16800 to keep up move intact.

if we start up move from here it will be last n final sub wave of this up move.which may run up to budget.

targets can be betn 17970 to 18555.

this rally shd be used to generate cash.

SENSEX

LOOK AT CHART

Wednesday, January 20, 2010

STOCKS TO WATCH

STOCKS TO WATCH FOR BUYING FOR VERY SHORT TERM. 

KEEP STOP LOSS AS PER YOUR COMFORT.

TISCO CMP 654

SAIL CMP 238

NIRMA CMP 225

MUKAND CMP 70

MARUTI CMP 1458


5 DAY SENSEX CHART

COMMENTS ON CHART

*************************************************
PRICE HAS NOT SUPPORTED +VE DIVERGENCE. YESTERDAY LOW IS NOT SUSTAINED SO MORE WEAKNESS TO BE SEEN

Tuesday, January 19, 2010

DYNAMATE TECH

CHART ATTACHED
*****************************************
cheers ! dynamite 1100+
6% up

*************************************
TARGET ACHIEVED TODAY ITSELF. TESTED 1199.

GEOMETRIC

CHART ATTACHED

CORE PROJECT

CHART ATTACHED